Bone Marrow Adiposity and Healthy Aging: What Fat Inside Bone May Reveal
Bone marrow adiposity may reflect changes in bone, metabolism, and blood-cell production. Learn what the signal means—and what it cannot prove.
Table of Contents
DISCLAIMER
This article is for informational purposes only and does not constitute medical advice. The statements in this article have not been evaluated by the FDA. The information presented is based on published research and should not be used as a substitute for professional medical guidance. Consult your physician before starting any supplement or health protocol.
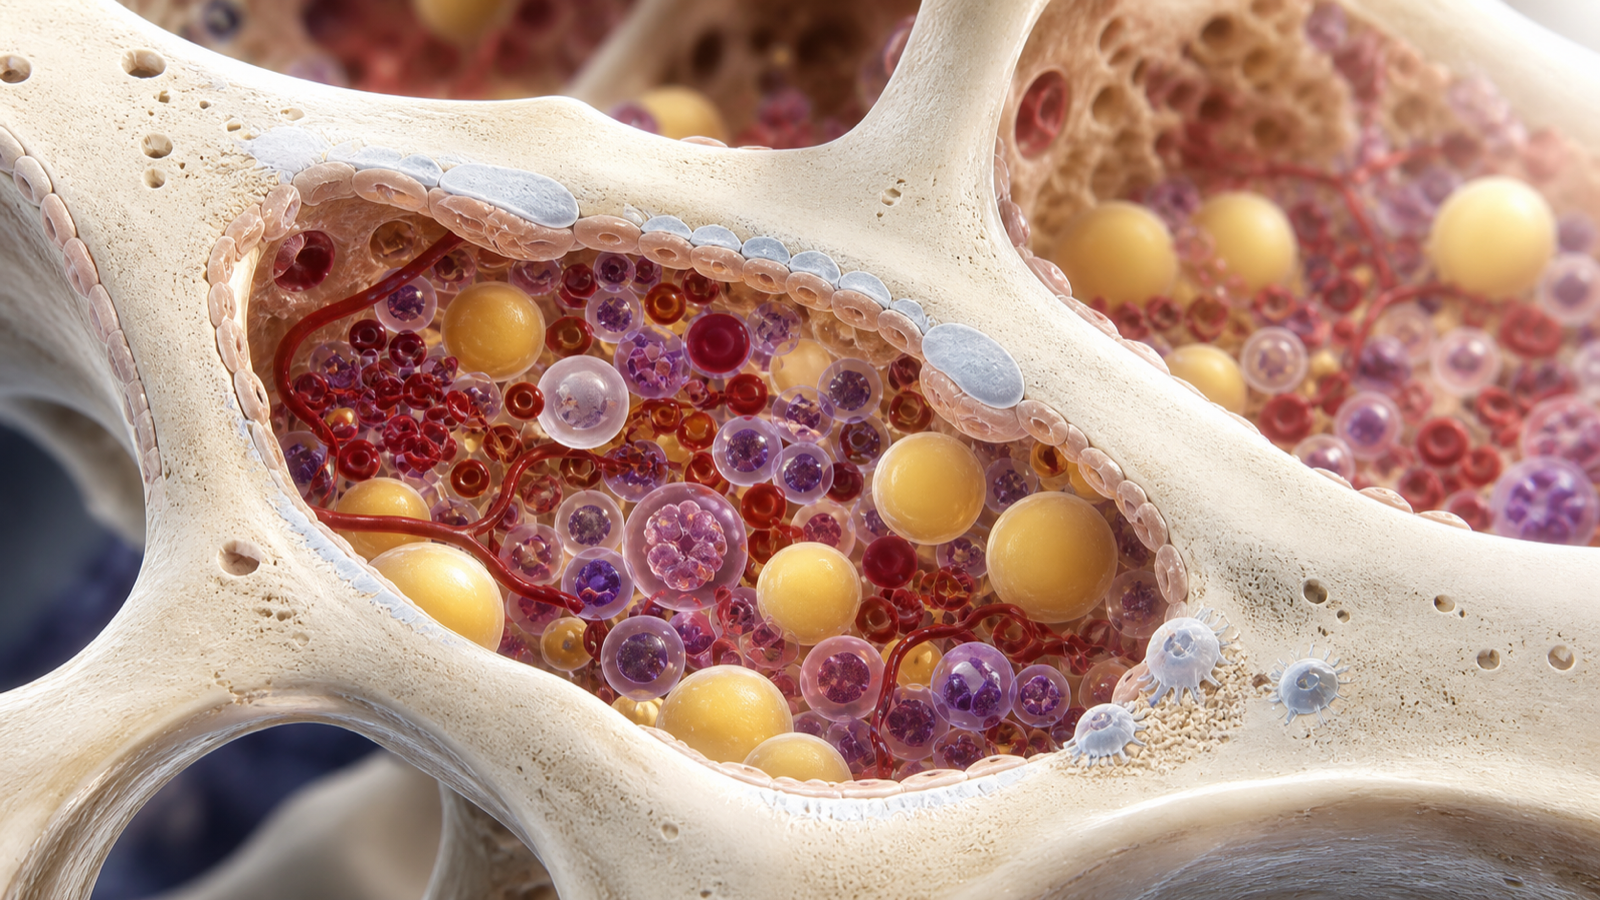
Fat inside bone sounds like a contradiction, yet adipocytes are a normal part of adult marrow. Interest in bone marrow adiposity and healthy aging has grown because this tissue sits beside bone-forming cells, blood-forming stem cells, nerves, and blood vessels. It may therefore record—or help shape—changes that ordinary body-fat measurements miss.
The tempting story is simple: more marrow fat equals weaker bone. Biology is less tidy. Marrow adipose tissue changes with age, skeletal location, energy availability, hormones, medications, and disease. It can expand during both obesity and severe calorie restriction. A measurement may be informative without functioning as a diagnosis or a biological-age score.
What bone marrow adipose tissue is
Bone marrow contains hematopoietic tissue that produces blood cells, stromal and skeletal stem cells, vascular structures, and adipocytes. During childhood, red marrow occupies much of the skeleton. With maturation, portions of it gradually become fatty yellow marrow, especially in the limbs. That conversion is normal.
Researchers often distinguish constitutive marrow fat, which develops predictably in distal bones, from regulated marrow fat in areas such as the spine and pelvis. Regulated depots appear more responsive to nutrition, hormones, exercise, and disease. These categories overlap, but they help explain why a single whole-body number cannot capture marrow biology.
Marrow adipocytes are metabolically active. They release fatty acids and signaling molecules including adipokines, cytokines, and extracellular-vesicle cargo. They also share progenitor pools and physical space with osteoblast-lineage cells. The key question is not whether marrow contains fat, but what its amount and behavior mean in a particular tissue at a particular time.
Why marrow fat tends to increase with age
Aging alters the bone microenvironment. Mesenchymal stromal cells may be more likely to follow an adipogenic rather than osteogenic program, while sex-hormone changes, oxidative stress, inflammation, reduced mechanical loading, and altered vascular function can reshape the local niche. The result can be more or larger marrow adipocytes alongside slower bone formation.
This does not prove that adipocytes directly cause age-related bone loss. Both may arise from common upstream changes. In some settings, marrow fat may provide fuel or protective buffering. In others, excessive lipid storage and inflammatory signaling may interfere with osteoblasts or blood-cell production.
The relationship also differs by site. Vertebral marrow fat measured by spectroscopy may associate with bone density or fracture risk, but values from the spine should not be assumed to represent every bone. Cortical thickness, trabecular architecture, muscle forces, falls, medications, and prior fractures still matter.
What human research can currently show
Cross-sectional studies commonly report higher marrow fat with older age and associations with lower bone mineral density. Postmenopausal osteoporosis has been a major research setting because estrogen decline affects both bone turnover and fat distribution. Some studies find that marrow-fat composition—the balance of saturated and unsaturated lipids—adds information beyond total quantity.
Associations are not interchangeable with prediction. A study can show that two features occur together without proving which came first. Small samples, different MRI sequences, inconsistent skeletal sites, and differences in age or disease make results difficult to compare.
Longitudinal and intervention studies are more useful but less abundant. They ask whether marrow fat changes before bone loss, responds to treatment, or predicts fracture independently of established tools. Results suggest potential, not readiness for routine consumer testing.
The metabolism paradox
Marrow fat can rise during anorexia nervosa and other states of energy deprivation even when external fat stores fall. That paradox shows why marrow adiposity cannot be interpreted like waist circumference. Local progenitor decisions, endocrine signals, and the marrow’s energy needs may outweigh total body fat.
Diabetes, glucocorticoid exposure, and some cancer therapies can also affect marrow composition. Anyone interpreting an imaging result needs the medical context rather than a generic “fat is bad” rule.
How marrow fat is measured
Histology can directly characterize marrow tissue but requires a biopsy and samples only a small region. MRI-based methods are noninvasive. Proton magnetic resonance spectroscopy estimates the fat fraction and lipid composition in a selected volume, while chemical-shift encoding MRI can map larger regions.
Standardization remains a challenge. Scanner field strength, sequence, anatomical site, hydration, and analysis choices can change values. Consumer body-composition scales, routine blood tests, and DXA scans do not directly measure marrow adiposity.
Practical implications for healthy aging
There is no validated “ideal” marrow-fat percentage to optimize. The practical response is to support bone and metabolic health through interventions already backed by clinical evidence: progressive resistance and impact exercise when appropriate, sufficient protein and energy, adequate calcium and vitamin D, avoidance of smoking, moderation of alcohol, and assessment of fall risk.
People with fractures from minor trauma, substantial height loss, prolonged steroid use, very low body weight, or other osteoporosis risks should discuss established evaluation with a clinician. That may include DXA, medication review, and laboratory assessment. A research MRI marker should not displace proven fracture-risk tools.
Exercise may influence the marrow niche through mechanical loading, improved insulin sensitivity, myokines, and circulation. Yet the goal should be stronger muscle, better balance, and healthier bone—not forcing a speculative imaging number downward.
Limitations and future research
The field needs reference ranges by age, sex, skeletal site, and metabolic context. Researchers also need to separate adipocyte quantity from quality. Cell size, lipid saturation, inflammatory state, and proximity to stem-cell niches may be more important than volume alone.
Future studies may combine marrow imaging with bone microarchitecture, blood markers, genetics, and fracture outcomes. Single-cell and spatial methods can clarify which marrow cells communicate and how those signals change with age. Trials must show that modifying marrow adiposity improves outcomes, not merely an image.
The bottom line
Bone marrow adiposity is a promising window into the aging skeletal microenvironment, but it is not a stand-alone health score. For now, established bone-density, strength, nutrition, and fall-prevention strategies remain more actionable than trying to optimize marrow fat itself.
Frequently Asked Questions
Is fat in bone marrow always unhealthy?
Can a routine bone-density scan measure marrow fat?
Can exercise reduce bone marrow adiposity?
Sources
Stay Updated on Longevity Science
Weekly research digests. No spam, unsubscribe anytime.
Related Articles

Ankle Power and Healthy Aging: The Push-Off That Keeps Walking Efficient
Ankle plantar-flexor power supports walking speed and balance recovery. Learn why push-off changes with age and how strength can be trained safely.
9 min read
Arterial Calcification and Vascular Aging: Reading the Risk Signals
Arterial calcification can reveal accumulated vascular risk. Learn what calcium scores mean, why calcification develops, and where testing has limits.
10 min read
Arterial Stiffness and Vascular Age: A Longevity Evidence Guide
Understand arterial stiffness vascular age longevity links, key studies, measurement limits, and evidence-based lifestyle implications for healthy aging.
11 min read